Lucerne Road Bridge – ANSYS Analysis
- Details
- Written by Guy Harder & Caleb Ledford
Introduction
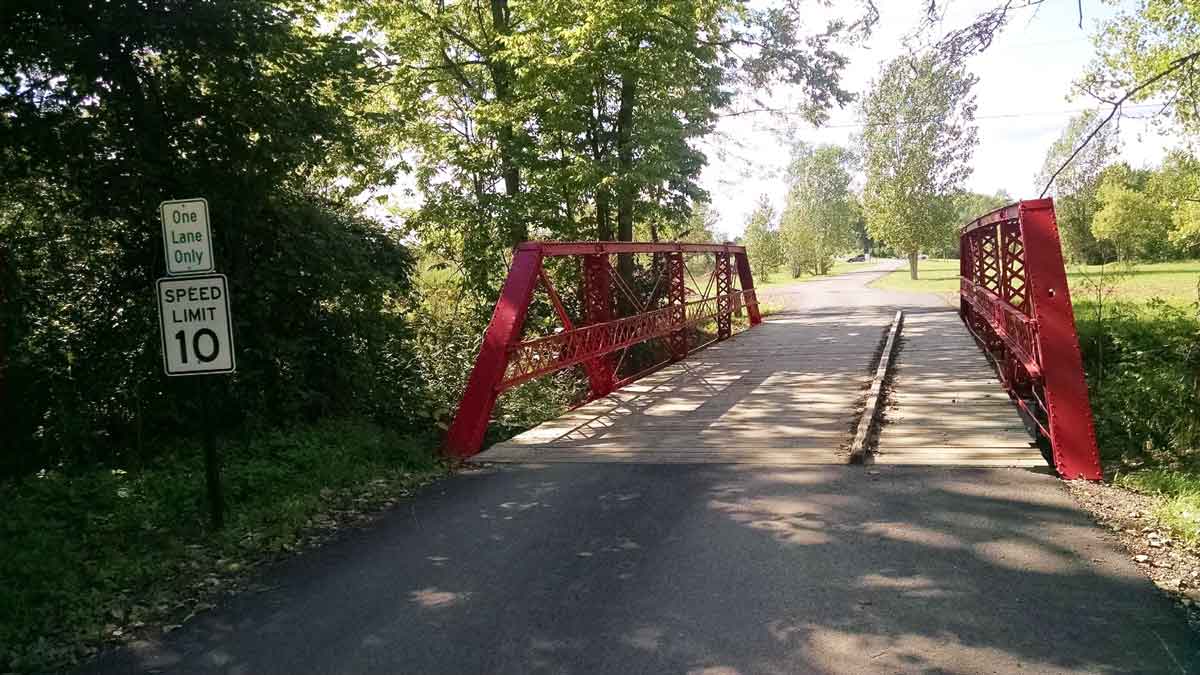
Ariel-Foundation Park is the home of many unique structures, including the Lucerne Road Bridge. The bridge, originally constructed around 1900 in northwestern Knox County, was rebuilt in 2003 and given a maximum load capacity of 6 tons. With methods learned in Statics, Strength of Materials, and Computer-Aided Engineering, an approach can be developed to model and test this claim.
Project Description
There were a few different parts to this project, all contributing to the bridge analysis. The tasks at hand included visiting the bridge site to gather data (including measurements, design, and dimensions), determining a way to model the bridge components that would give reasonable and usable output values, and creating and analyzing the model.
A Few Important Terms
The Lucerne Road Bridge is a truss bridge by design. According to Wikipedia, a truss bridge is a bridge whose load-bearing superstructure is composed of a truss, a structure of connected elements usually forming triangular units. The connected elements (typically straight) may be stressed from tension, compression, or sometimes both, in response to dynamic loads. A truss bridge is economical to construct because it uses materials efficiently.
An I-beam is a beam with an I-shaped cross-section. I-beams are usually made of structural steel and are used in construction and civil engineering (source: Wikipedia.com).
Elasticity is a material property that describes the continuum mechanics of bodies that deform reversibly under stress. Most springs exhibit elasticity property.
In engineering design, particularly in the creation of 3D assemblies and multibody systems, the plural term constraints refers to demarcations of geometrical characteristics between two or more entities or solid modeling bodies (source: Wikipedia.com).
Yield strength or yield stress is the material property defined as the stress at which a material begins to deform plastically, whereas yield point is the point where nonlinear (elastic + plastic) deformation begins. Prior to the yield point, the material will deform elastically and will return to its original shape when the applied stress is removed. The yield point determines the limits of performance for mechanical components, since it represents the upper limit to forces that can be applied without permanent deformation (source: Wikipedia.com).
A node is a point on the mesh generated by the testing software that corresponds to the geometry (shape) of the part being analyzed. Forces can be applied to these nodes and deformation of the nodes will be calculated by the software.
Modeling Assumptions
The project used ANSYS, a computer-based engineering program that analyzes stress on structures, to model the bridge with a two-dimensional truss model. The material of the bridge is assumed to be A-36 steel, a common structural steel being used in the industry. Some material properties include Modulus of Elasticity E = 29,000,000 psi, Poisson’s ratio = 0.32. Constraints were made at both ends of the truss and I-beam (nodes 1 and 5) in all directions.
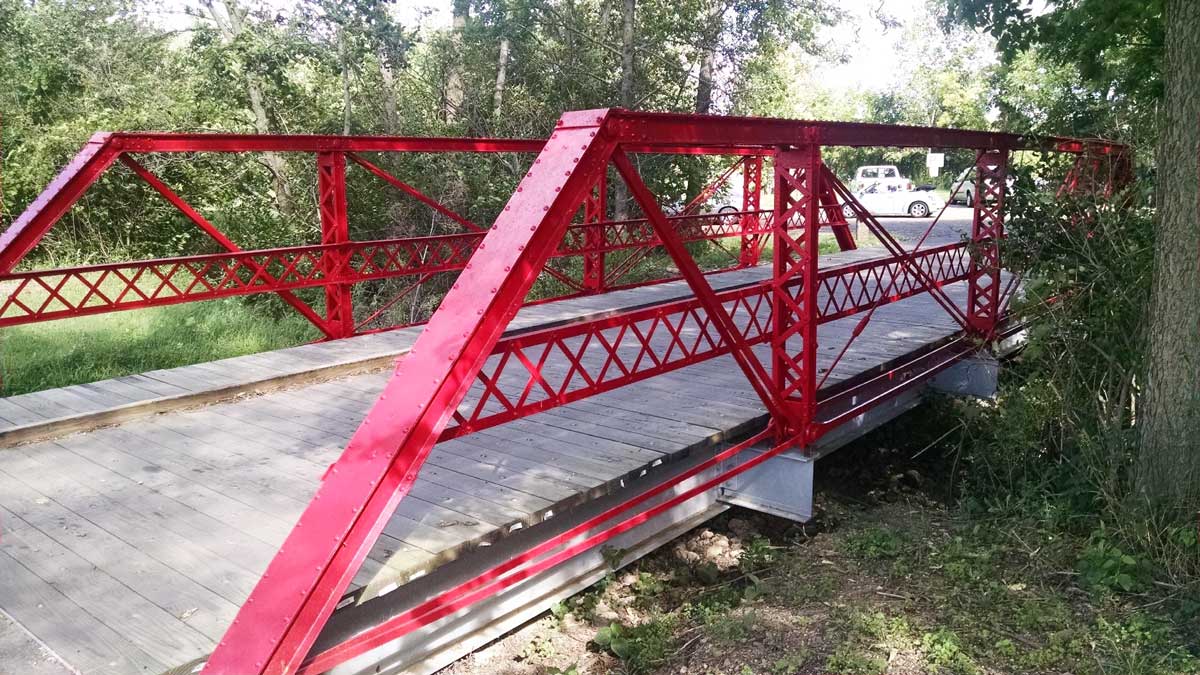
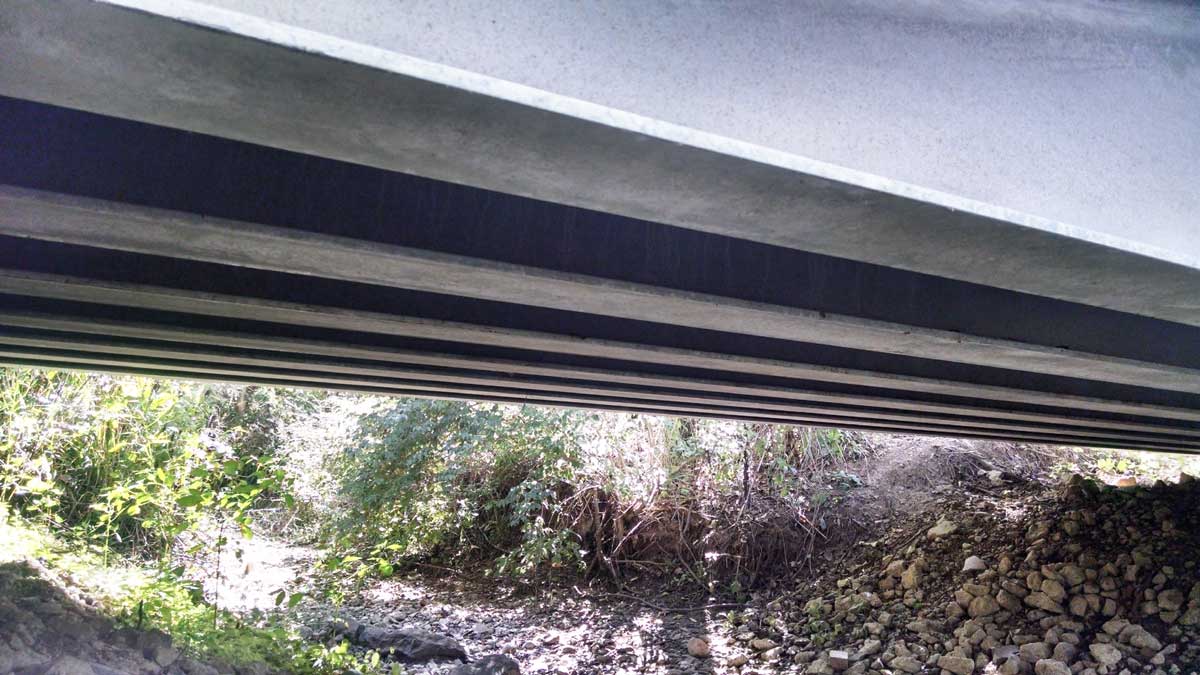
Modeling Procedure
To create the truss system, nodes were made at each point where two elements were connected using the dimensions and measurements we took in the field. Different elements in the truss system were given different cross-sections and connected between nodes. The I-beam was created using simple beam modeling. The cross-sectional dimensions were entered and the element was connected between nodes to create the beam that runs parallel to the bridge, all the way along its underside. For both models, the forces were added in the same way. For a force of 6 tons to act on the bridge, we assumed that the least number of nodes it would be distributed across is 3. (This takes you to the bridge’s midpoint. A large vehicle is about this length of 20–25 ft). Two different scenarios were used. In the first scenario, forces were applied at nodes 2, 3, and 4. In the second scenario, forces were applied at nodes 1, 2, and 3. For the truss model, a 2D system would only be affected by half of the load. So, we distributed 3 tons, or 6,000 lbs, across 3 nodes. For the I-Beam (because there are 7 identical beams supporting the bridge), 1/7 of the 6 tons would be acting on each beam. So, we distributed 1/7 of 6 tons, or approximately 1,714 pounds, across 3 nodes.
Results and Interpretation
The engineers claimed that the bridge could withstand a load of 6 tons, or 12,000 pounds. For bridge construction, a high-risk structure, a safety factor of 5–7 is used. The ultimate strength of structural A-36 steel is 58,000 psi, and the yield strength is 36,000 psi. Our maximum stress in the truss system was 2,146 psi in compression and 1,859.5 psi in tension. Both are well under the safety factor and do not put the bridge at risk. The maximum stress in the I-beam was 5,586 psi (seen in scenario 1). This is between 1/6 and 1/7 of the yield strength. Theoretically, the bridge should be very safe under a 6-ton load. However, this is approaching the safety factor previously mentioned. Our data very closely agrees with the theoretical claim made by engineers for this bridge. Exceeding a 6-ton load would compromise the safety factor for structural steel.
Charts, complete results, and additional information are attached to the Lucerne Road Bridge Power Point Presentation.
Conclusion and Future Work
From a personal aspect, we feel very good about the work we did for this project. It is one thing to analyze imaginary problems from a textbook, but it really brings the material to life when you can be out in the real world with a project like this. It should certainly be mentioned that these numbers and results are not perfect. For one thing, both methods for analyzing the bridge require models, which were simplified to a point where we could use them. In that process, some accuracy will always be lost. Also, ANSYS has many ways to analyze values, especially for stresses. We used line element analysis and nodal displacement, but other methods could have resulted in different numbers. We believe that our overall conclusion that the bridge can safely hold 6 tons is true and can be stated confidently. This experiment and project could be expanded in the future by creating a 3D model of the bridge, testing different load points and values, and testing completely different bridges and structures.